What are HCELLS (Harvested Cells):
The different types of cells in our model are:
NCells denote the total number of cells in our grid.
HCells are the harvested cells.
Hcells denote the harvested cells in our grid which can not catch fire and act as breaks to wildfires. These cells could have been harvested either by earlier fires or can strategically be cut to reduce the spread of fire and arrest the spread of fires so that large contiguous areas don’t catch fire.
To simulate the program with harvested cells, we need to run the program and set-up the Cell2Fire folder from github. Then we run the program and once the file structure is created in our Cell2Fire document, we could open the Data folder and create a new .csv file to provide input for –HarvestedCells command.
How to create a new CSV file
A harvested cells file has comma separated values (it is a .csv file). IOt should contain the year number and the cell numbers as inputs; e.g. 1, 1, 2, 3, 5, 8 indicates that before year 1, cells 1,2,3,5, and 8 are already harvested. Once we have created the CSV file we could save it as harvestedCells.csv in the following path ../data/Harvest40x40.
Note: The 1st row of the .csv file is not parsed by cell2fire, therefore we could provide “Year number” and “Cell Numbers” in the 1st row. In the second row we can provide our inputs.
Now to simulate the program we would need to provide the inputs required by each function. For –HarvestedCells we would have to provide the location of the harvestedCells.csv file as an input.
Illustrations 1:
For our 1st illustration we save our harvestedCells.csv file with just three harvested cells. We have take the year number and cell numbers as 1,936,976,1056. Once we save the harvestedCells.csv file with the following command:
Input Command:
python main.py --input-instance-folder ../data/Harvest40x40/ --output-folder ../Harvest40x40 --ignitions --sim-years 1 --nsims 5 --grids --finalGrid --weather rows --nweathers 1 --Fire-Period-Length 1.0 --output-messages --ROS-CV 0.8 --seed 123 --stats --allPlots --IgnitionRad 1 --grids --combine --heuristic 1 --GASelection --HarvestedCells ../data/Harvest40x40/harvestedCells.csv
Output:
Once we run the program we create a series of outputs in Harvest40x40 folder which would be saved in the Cell2Fire directory. The Harvest40x40 folder will have the output in the form of Grids, Plots and Stats.
We could show how the fire has spread through the BP_HeatMap.png saved in the Stats Directory.
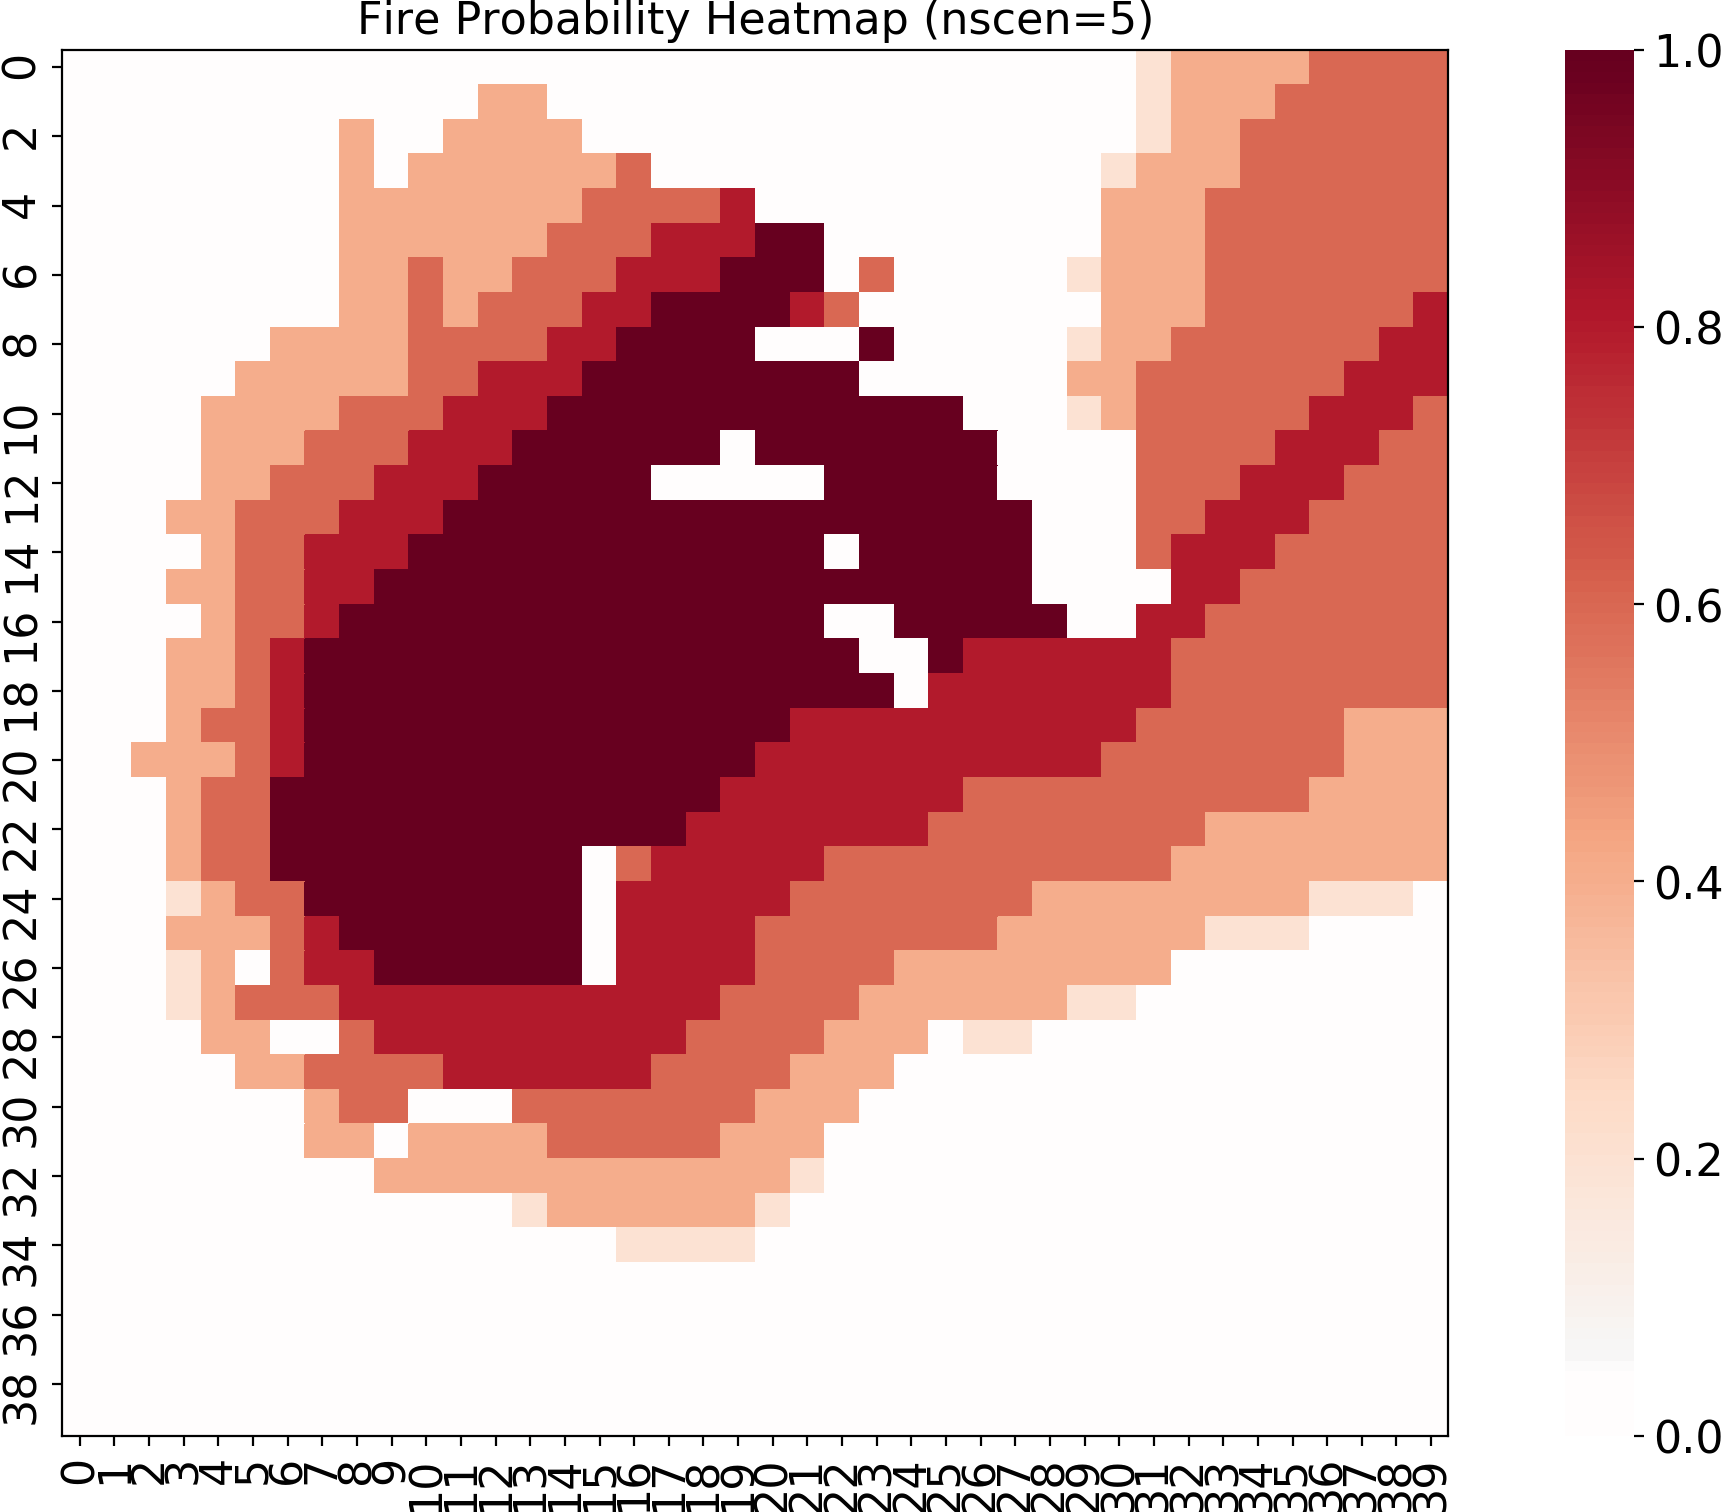
We can see as the harvested cells are very few, we can not fully stop the propogation of fire. It spreads spreads and covers the entire firest area.
Illustrations 2:
python main.py –input-instance-folder ../data/Harvest40x40/ –output-folder ../Harvest40x40 –ignitions –sim-years 1 –nsims 5 –grids –finalGrid –weather rows –nweathers 1 –Fire-Period-Length 1.0 –output-messages –ROS-CV 0.8 –seed 123 –stats –allPlots –IgnitionRad 1 –grids –combine –heuristic 1 –GASelection –HarvestedCells ../data/Harvest40x40/harvestedCells.csv
Output:
Once we run the program we create a series of outputs in Harvest40x40 folder which would be saved in the Cell2Fire directory. The Harvest40x40 folder will have the output in the form of Grids, Plots and Stats.
We could show how the fire has spread through the BP_HeatMap.png saved in the Stats Directory.
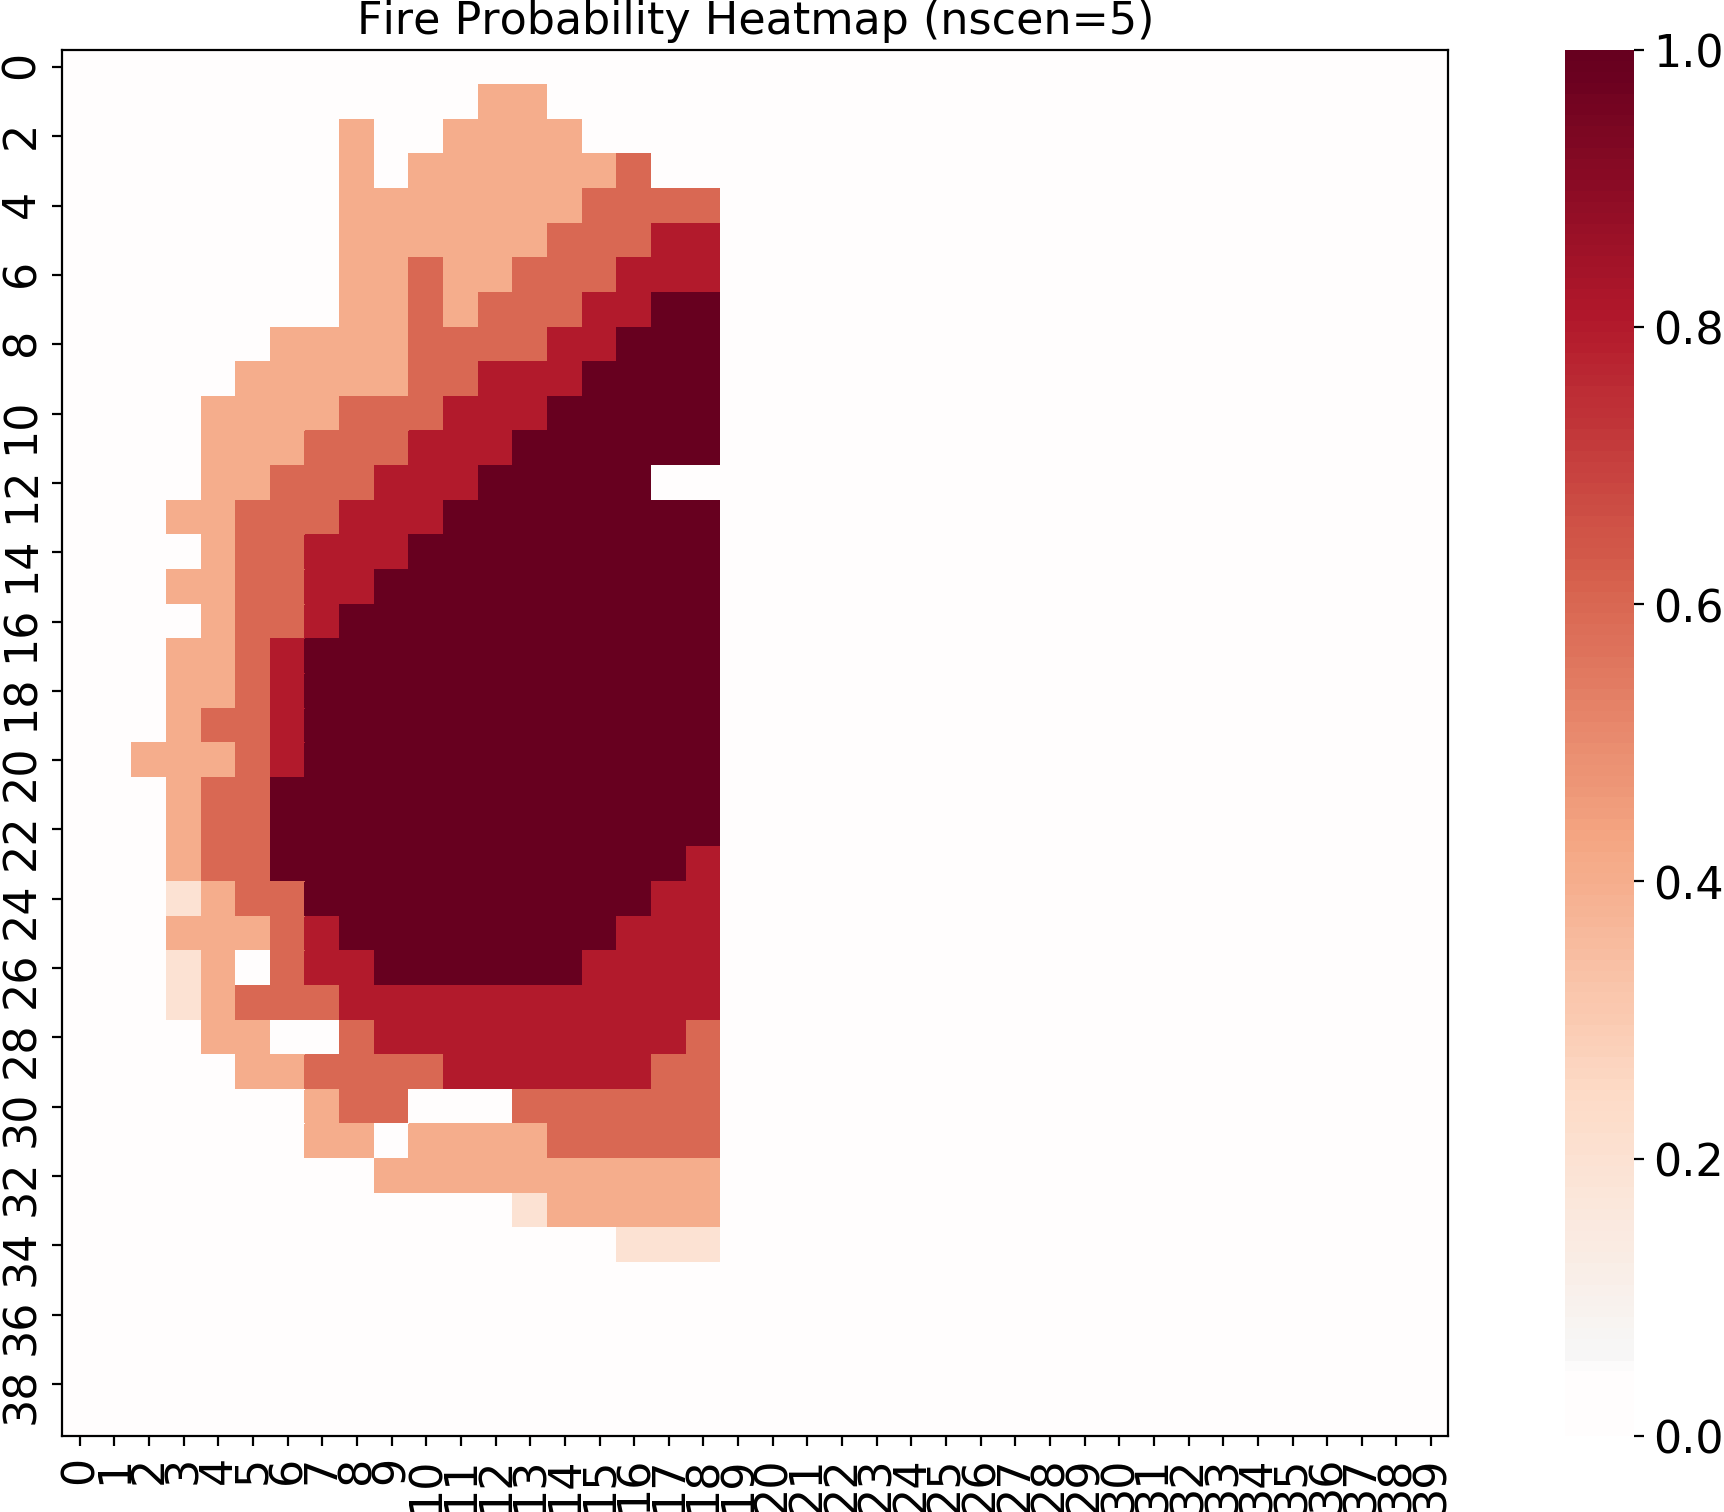
As we have harvested enough cells the fire does not propogate. We have strategically harvested cells in a staight line starting from cell 20,60,100..1580. This results in stopping fire spread even though there is more forest cover which would be burnt if we did not stop its propogation.
Illustrations 3:
For our 3rd illustration we save our harvestedCells.csv file with multiple harvested cell (1,42,83,124..,16000). We have harvested the forest diagonally to see how the fire propogates. We have take the year number and cell number as 1,1,42,83,124..,1600. Once we save the harvestedCells.csv file with the following inputs we can parse them using our program. The command for our program with their respective inputs is as shown below.
Input Command:
1 python main.py --input-instance-folder ../data/Harvest40x40/ --output-folder ../Harvest40x40 --ignitions --sim-years 1 --nsims 5 --grids --finalGrid --weather rows --nweathers 1 --Fire-Period-Length 1.0 --output-messages --ROS-CV 0.8 --seed 123 --stats --allPlots --IgnitionRad 1 --grids --combine --heuristic 1 --GASelection --HarvestedCells ../data/Harvest40x40/harvestedCells.csv
Output:
Once we run the program we create a series of outputs in Harvest40x40 folder which would be saved in the Cell2Fire directory. The Harvest40x40 folder will have the output in the form of Grids, Plots and Stats.
We could show how the fire has spread through the BP_HeatMap.png saved in our Stats Directory.
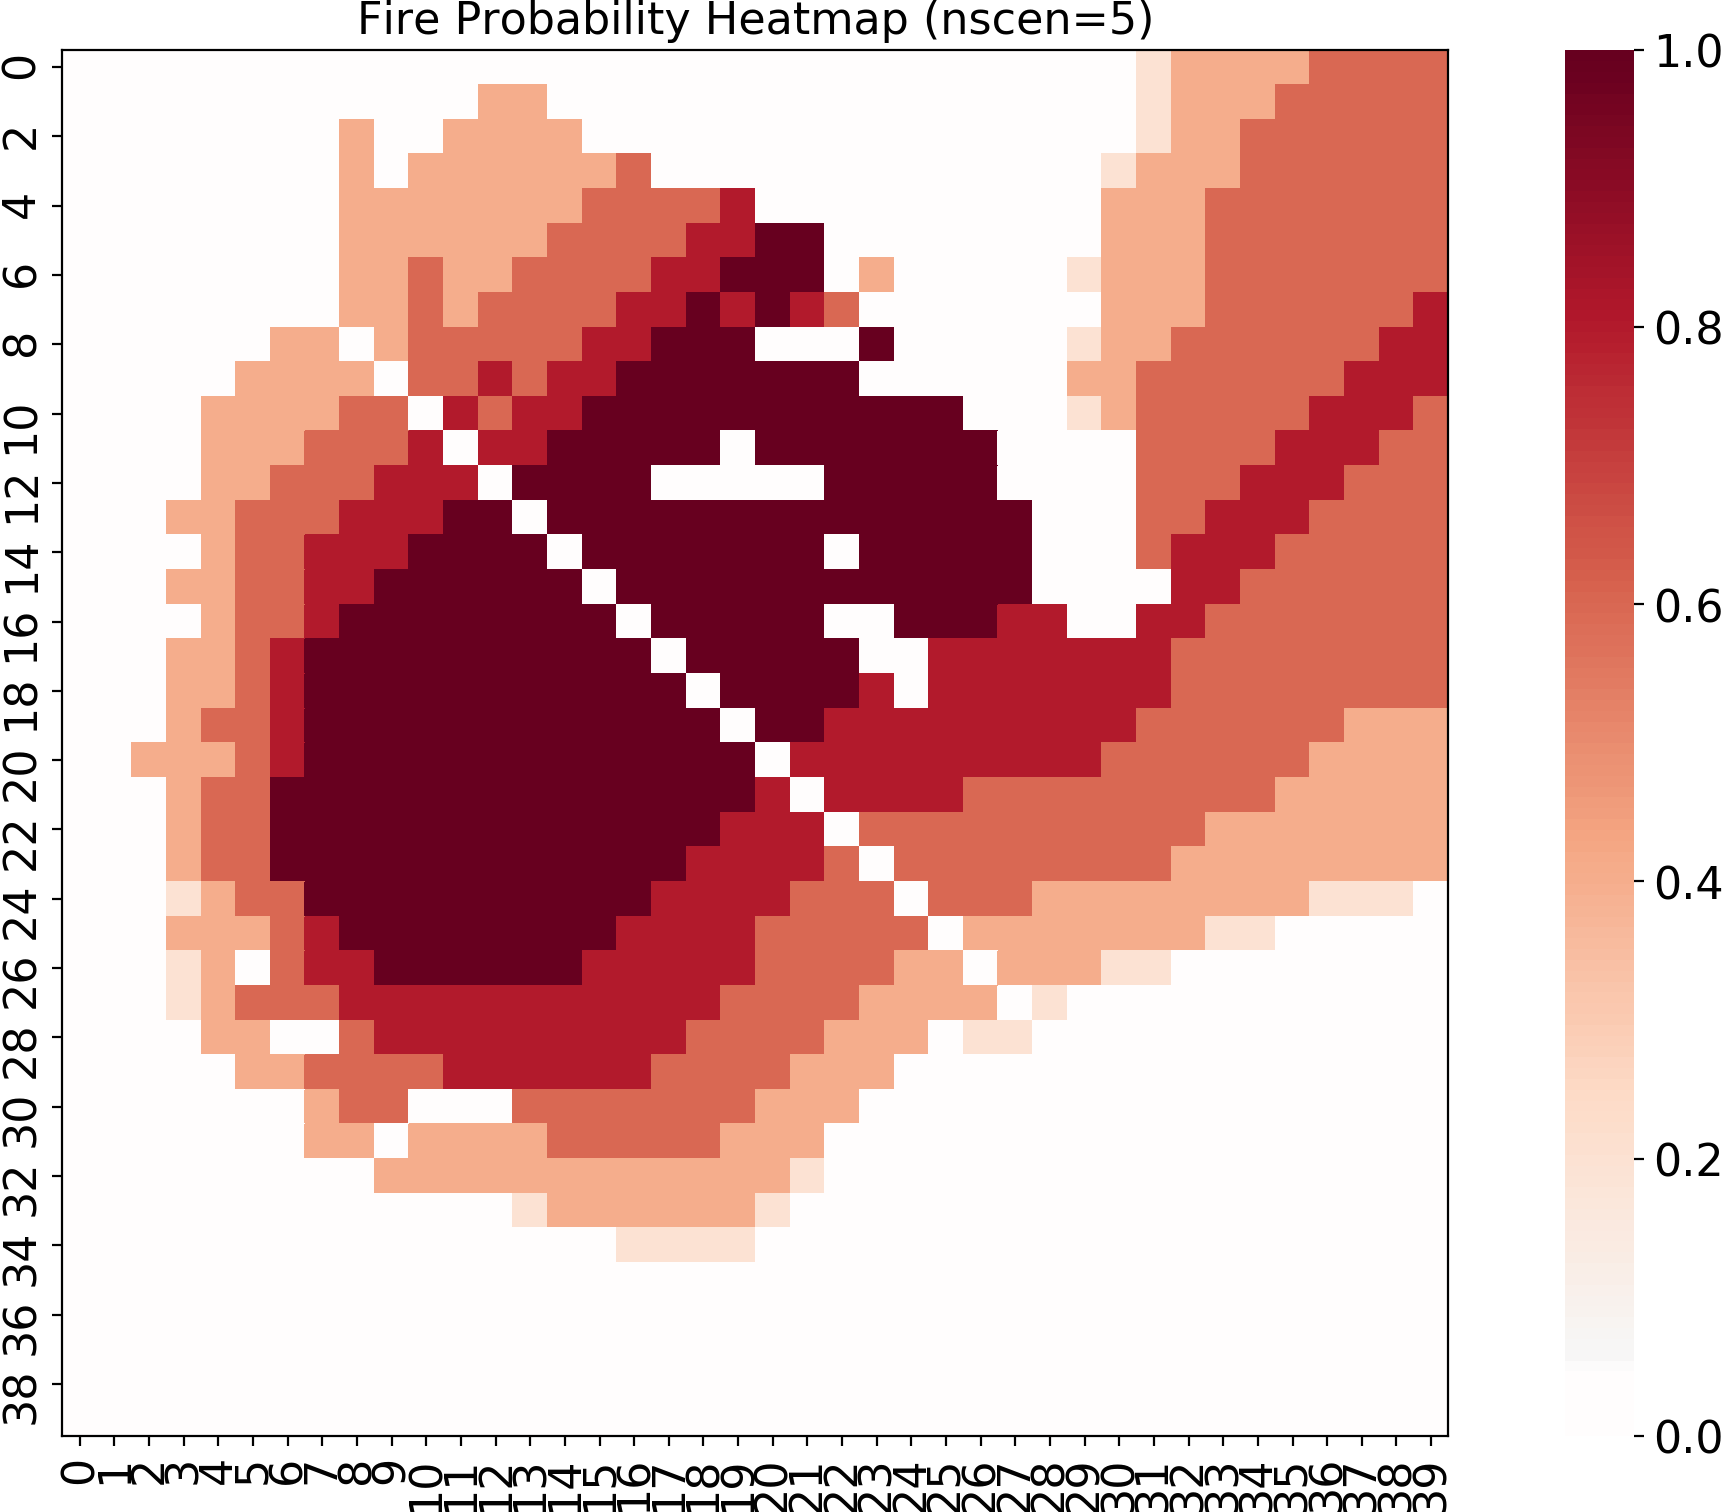
As we can see even though we have harvested the cells in a diagonal the fire still spreads. This particular example would help to strategically decide on how to harvest the forest. It also shows that the fire would spread even if the adjacent cells are in contact with the burning cells with just their corners in contact with each other. Therefore to completely arrest spread of fire there should be no contact between forested cells and the ones having an active fire.
Application:
The output of the program would be stored in Cell2Fire document. We can access the new folder that would be created after running the program and access the various Plots, Stats, Grids, and messages.
By running multiple simulations we could reach an optimal solution which would enhance our chance to utilize our model to effectively manage the spread of forest fires.